US Foods · Data Visualization · Enterprise UX
Win the Day
Turning fragmented customer data into actionable insights, helping sales managers understand performance, identify opportunities, and make more informed daily decisions.
From fragmented data to proactive decisions.
Leading the design of a customer-performance experience that helps territory and district managers see what matters, understand trends, and act with confidence.
Data everywhere. Clarity nowhere.
Territory and district managers needed to understand customer ordering behavior and performance, but relevant information was scattered across SOUS, MOXe, and Excel documents used to track accounts.
Comparing performance, spotting declines, and deciding which customers needed attention required manual effort. The opportunity was not simply to display more data—it was to make the information meaningful enough to support daily decisions.
Before: Multiple systems
Customer information spread across separate tools.
Before: Manual tracking
Spreadsheets and calculations to interpret trends.
Opportunity: One clearer view
Customer health, performance context, and next steps.
How might we help managers spend less time interpreting data and more time taking action?
Leading from discovery through delivery.
As Lead Product Designer, I own the experience from discovery through implementation and ongoing iteration. I work directly with SVP-level business stakeholders, product managers, product owners, analysts, and developers to frame problems, explore solutions, negotiate requirements, and align the experience with technical feasibility.
Our UX researcher led the initial usability sessions, which I observed. I continue to participate in feedback sessions with territory and district managers alongside the PM and PO, reviewing mockups and validating whether individual data points are meaningful to their work.
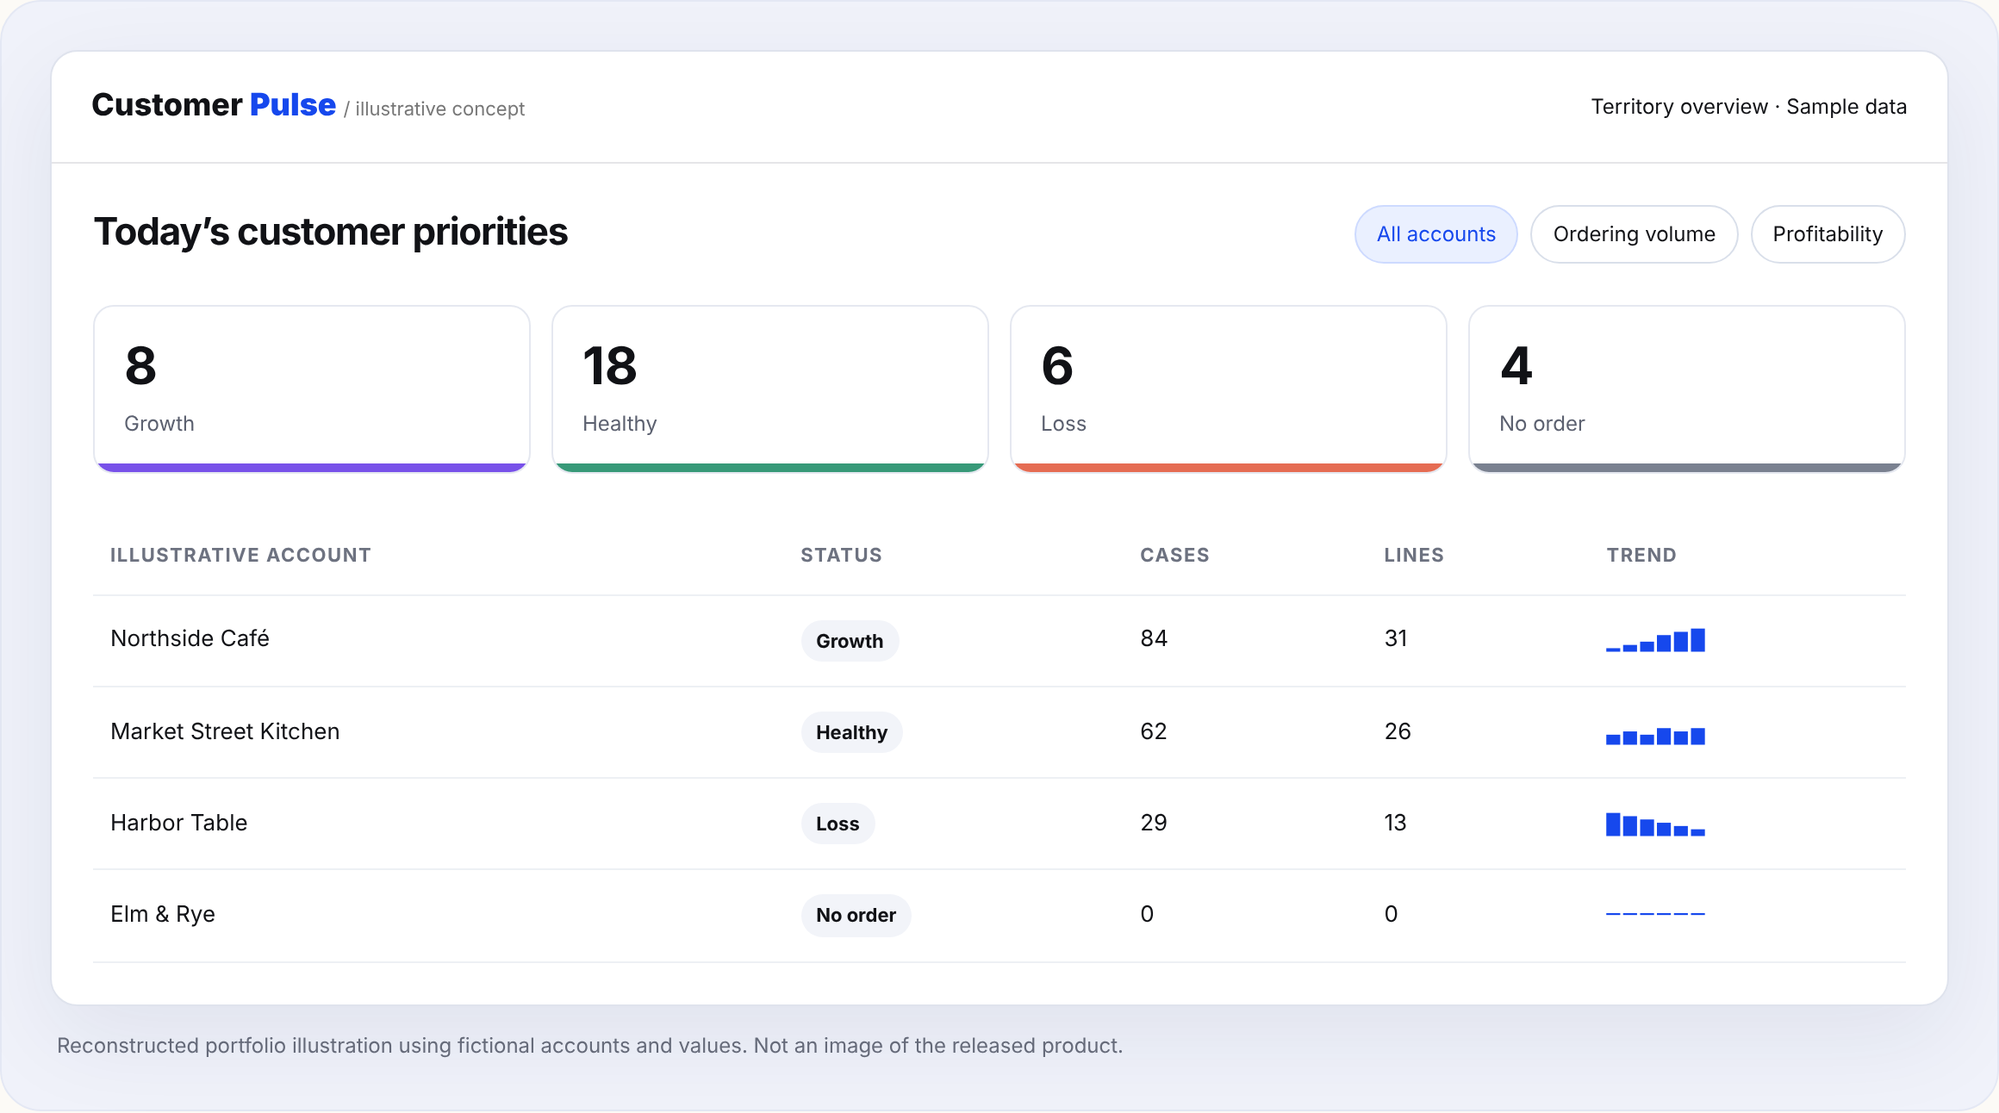
Make customer health visible at a glance.
We brought performance indicators into a unified dashboard, with Growth, Healthy, Loss, and No Order statuses to help managers identify where to focus. Customer-level summaries connect the big picture to individual accounts.
Not more data. More meaningful data.
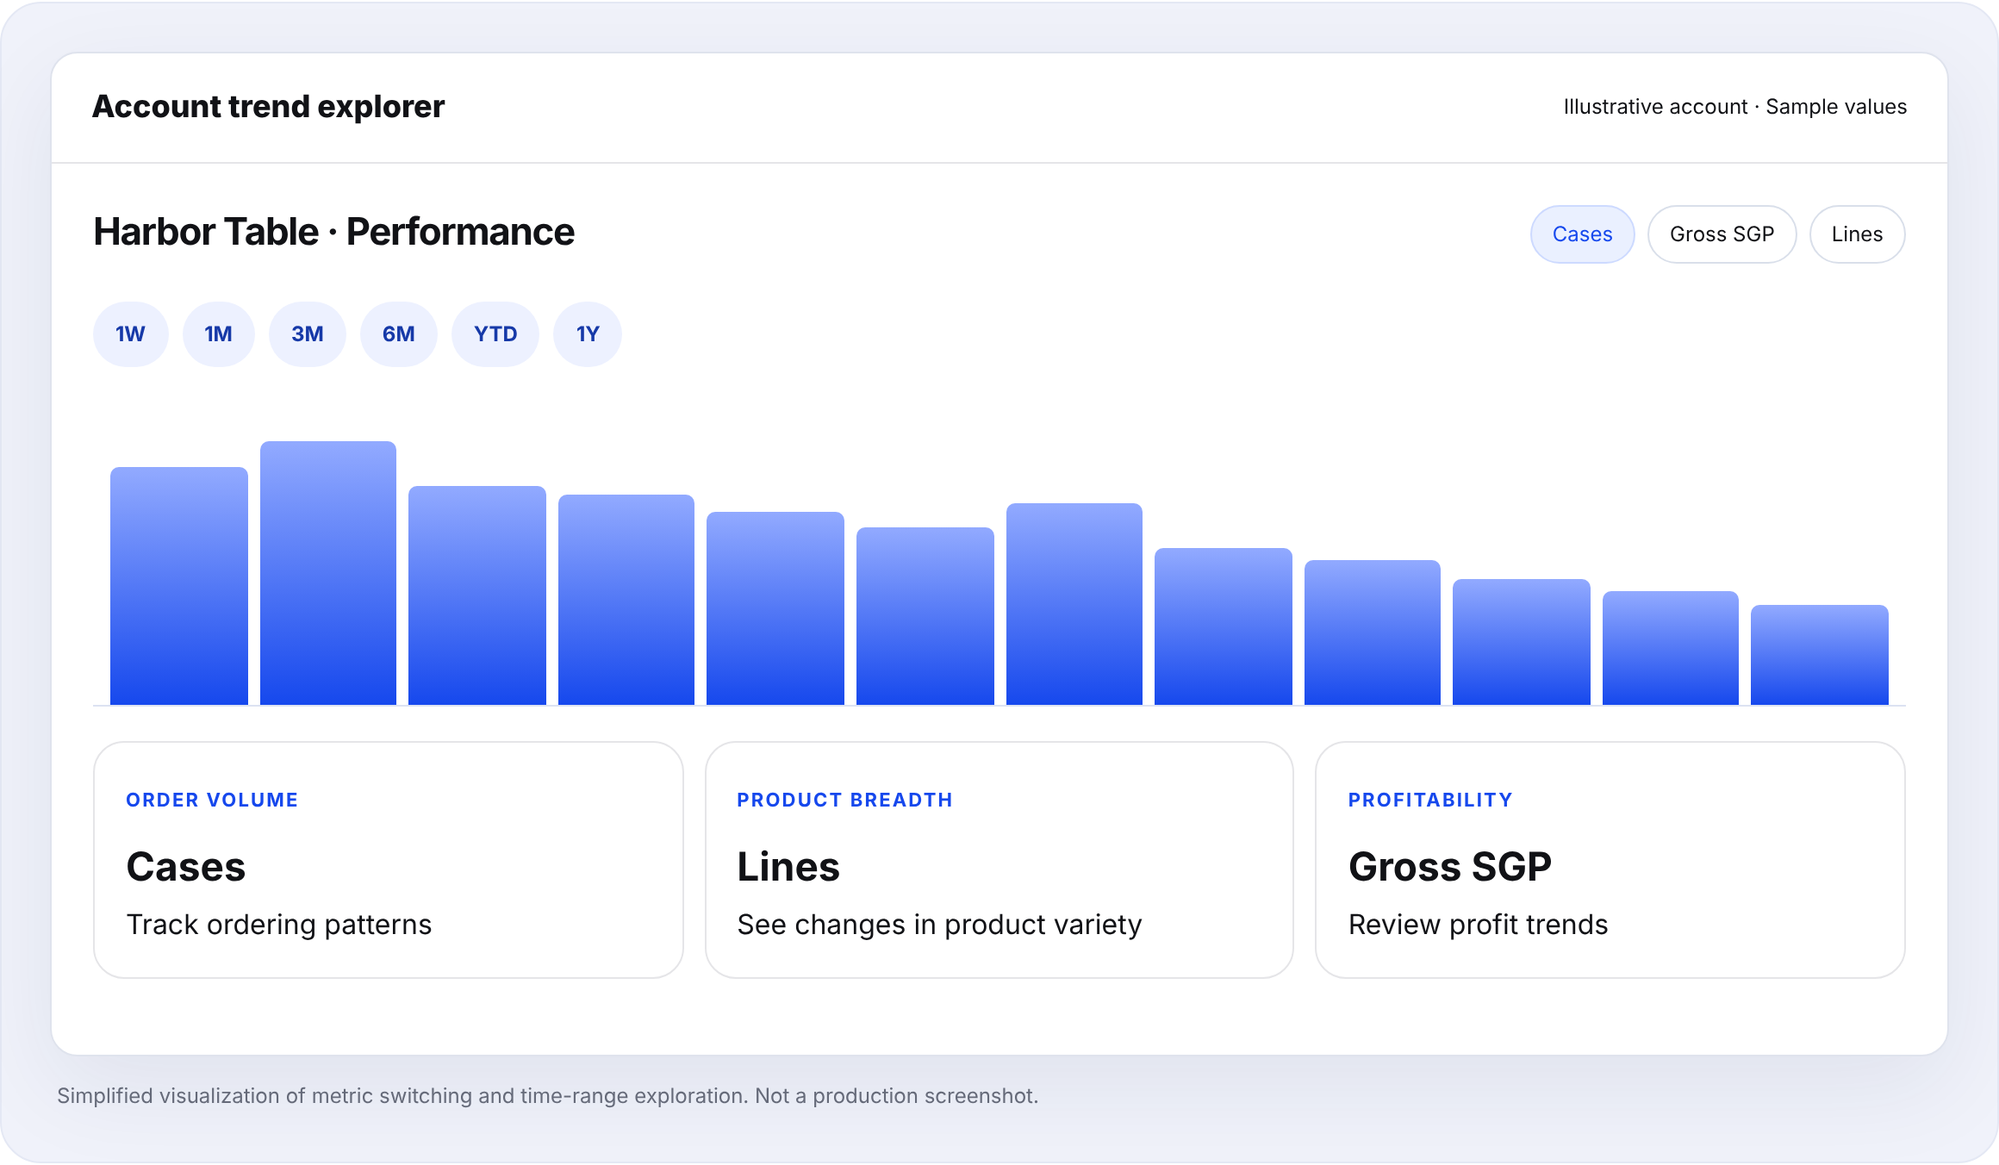
Our earliest trend explorations centered on seven-day and four-week views. Feedback revealed that managers also needed longer horizons to understand patterns, set goals, and plan customer actions.
We expanded the experience to support one week, one month, three months, six months, year to date, and one year across Cases, Gross SGP, and Lines. Feedback also informed the addition of Service Level without Substitutions and Average On-Time Delivery metrics.
EARLY EXPLORATION
Short-term visibility
7 days · 4 weeks
Focused on recent activity and initial performance comparisons.
FEEDBACK-DRIVEN EVOLUTION
Flexible performance context
1W · 1 M · 3 M · 6 M · YTD · 1Y
Multiple decision horizons across Cases, Gross SGP, and Lines, complemented by operational performance metrics.
Aligning user needs with what we could build.
Additional requests did not go directly from feedback to UI. I held multiple discussions with business stakeholders to clarify the need behind each request, then investigated data availability and feasibility with analysts and the development team.
These conversations helped the team weigh value, technical constraints, and priorities before evolving the experience. The goal was not to accommodate every data point, but to ensure that the information we introduced supported a meaningful decision.
Design principle
A metric earns its place when a manager can understand what it means and how it might influence their next step.
Make the next step easier.
The live experience extends beyond reporting. Managers can identify accounts in Loss or No Order, explore supporting performance trends, see exceptions and defect indicators, and access resolution entry points. Connections to Order Insights and SOUS provide additional context.
See the signalCustomer health categories bring attention to changing performance and missing orders.
Explore the contextCompare metrics, time ranges, and operational performance to understand an account
Follow throughUse exception-resolution entry points and connected tools to pursue next steps.
Conceptual workflow illustration; detailed internal rules and unreleased capabilities are intentionally omitted.
Live, useful, and still evolving.
The dashboard has been implemented and released. Ongoing feedback from territory and district managers has been positive, with users describing the experience as easy to use and helpful in their daily work.
We continue to validate information with users, improve the experience, and explore future enhancements. The work demonstrates the value of treating launch as a milestone—not the end of product design.
No quantitative performance or time-savings claims are made here; the feedback described is qualitative.
Designing the right decisions, not just the right screens.
What made this project meaningful was the combination of product complexity and collaboration: turning scattered data into an understandable experience, challenging whether each metric was useful, negotiating feasible improvements, and supporting a live product through continued iteration.
As the lead designer, I helped connect user needs, business priorities, and technical realities into an experience built around clarity and action.